Analytics Overview
Here is a summary of Diskover’s analytics views and reports.
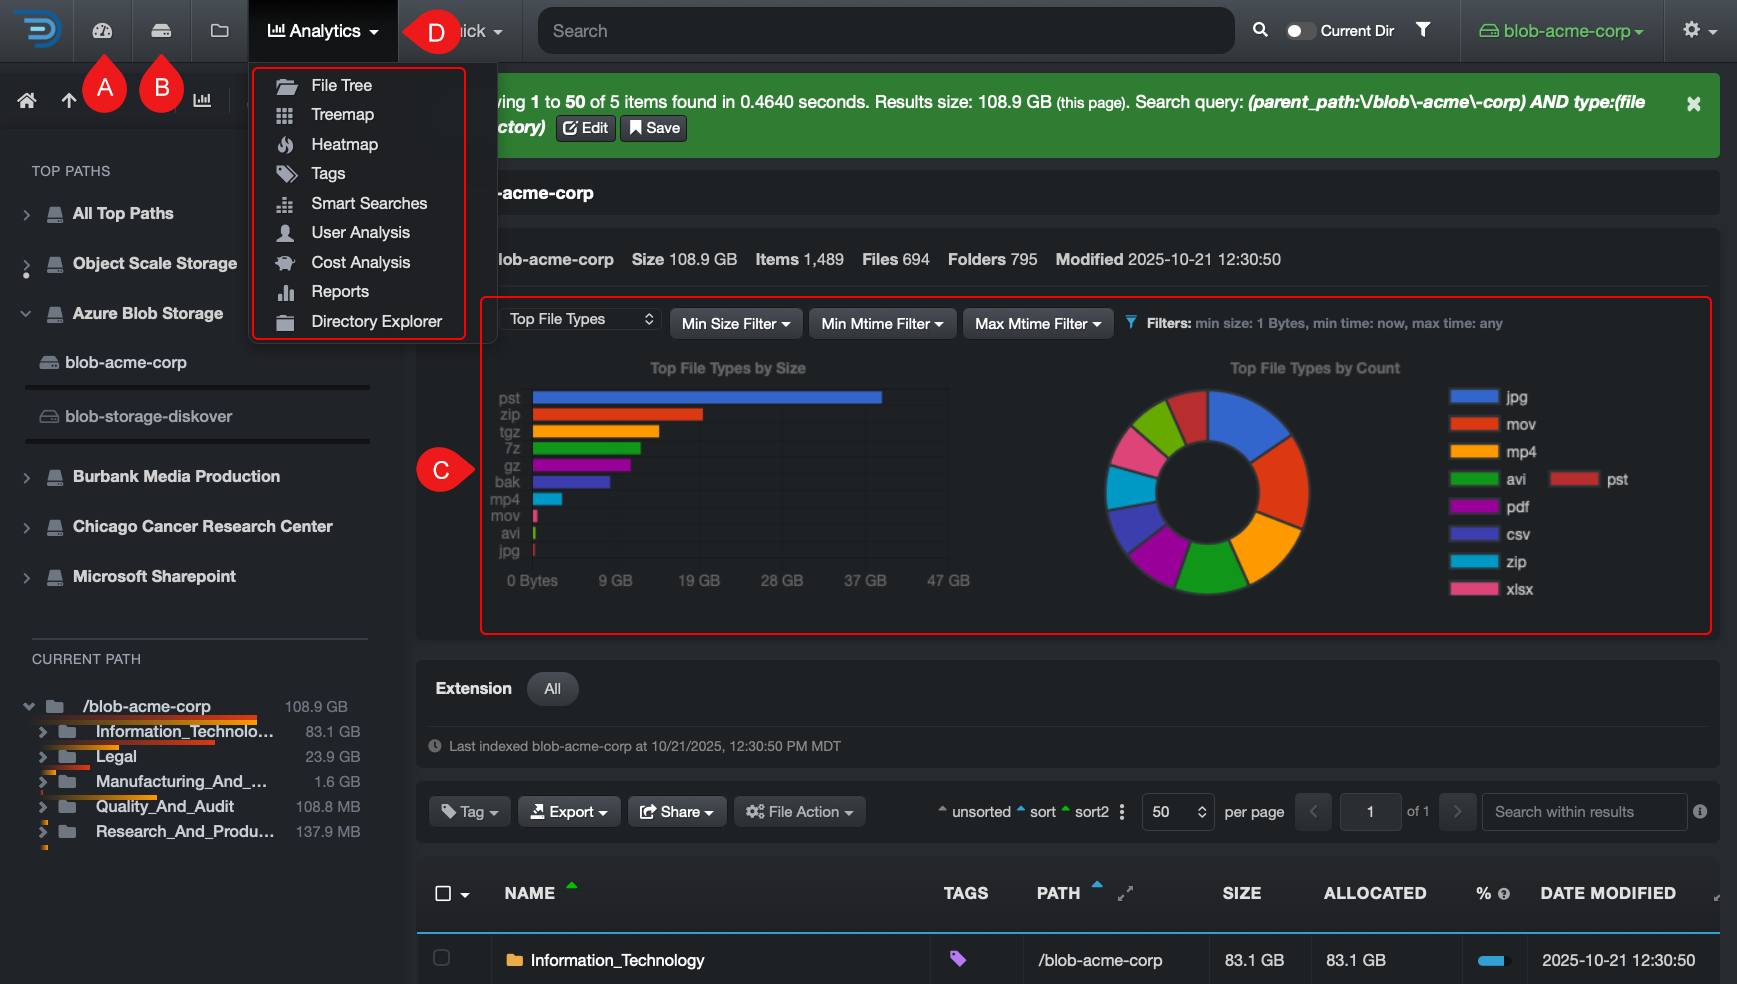
⚙️ Indicates analytics that can be customized for your organization.
CALLOUT |
ANALYTIC |
DESCRIPTION |
A |
Dashboard |
Snapshot of your data, with clickable insights at both global and volume/path levels to quickly explore details. |
B |
Storage Space Information |
Overview of storage capacity across indexed locations, including total, used, and available space with utilization percentages. |
C |
Search Page Charts |
Displays charts for the current path, including aging, top files, and top directories. The charts update as you navigate or change the search. |
D |
Analytics drop-down |
File Tree: Instant profiling of directories by size and aging. Treemap: Displays hierarchical data using rectangles to represent directory sizes. Heatmap: Compares 2 indices from 2 points in time, giving an instant visual of data growth or shrinkage. Tags: Analyzes tagged datasets by tag name, size, and item count. ⚙️ Smart Searches: Customizable report tailored to what's relevant to your organization. User Analysis: Gives insights into data consumption and cost per user and group. ⚙️ Cost Analysis: Customizable report for analyzing estimated storage costs across your data. ⚙️ Reports: Customizable report to help you find your top unknowns and areas of impact. Directory Explorer: Provides a visual breakdown of file size, age, and activity across your directory structure. |

Comments
0 comments
Please sign in to leave a comment.